


Tsunami Ghost Boat Drift According to OSCURS - March 27, 2012
By Curtis C. Ebbesmeyer, Beachcombers’ Alert,
Jim Ingraham, DriftBusters Co.,
Please report flotsam to:
On March 20, 2012, Canada’s Department of National Defense spotted a derelict vessel on the order of 100-feet long off the Queen Charlotte Islands (Figure 1). Subsequent investigation traced the vessel to northern Japan where the great tsunami of March 11, 2011, washed it out to sea.
Using the computer model known as OSCURS (Ocean Surface CURrent Simulator; see other blogs at this website for descriptions of OSCURS), Jim Ingraham reconstructed the drift of the vessel ending on February 29, 2012, the last date for which daily weather data is available from the US Navy via NOAA (National Oceanic and Atmospheric Administration; Figure 2).
Jim achieved a reasonable simulation of the vessel’s drift using a wind factor of 2.1. Jim will receive the daily March weather from the US Navy via NOAA in the first few days of April. This will allow him to update OSCURS for March showing where and when the vessel might come ashore. We will update the vessel’s drift in a subsequent blog.
Judging from the devastation in Japan, we believe additional vessels set free by the tsunami are drifting toward America. Figure 3 shows the OSCURS simulation we believe indicates where these other vessels may be heading. The destinations range from the Gulf of Alaska south to waters between California and Hawaii. Some vessels may loop around the Gulf of Alaska and the Great Garbage Patch located between California and Hawaii.
We urge mariners to be vigilant. Please report derelict vessels to Curt at www.flotsametrics.com.
Figure 1. Aerial photo of the Japanese fishing vessel discovered adrift off the Queen Charlotte Islands. Photo credit: Canada’s Department of National Defense.

Figure 2. OSCURS drift for Japanese Boat No. 1 using wind factor 2.1 ending on February 29, 2012. The trajectory (wiggly line) from the start-point proceeds day by day according to the weather data at the location of the vessel. The trajectory ends on February 29, 2012, the last date for which daily weather data are available from the US Navy. Jim Ingraham OSCURS simulation.
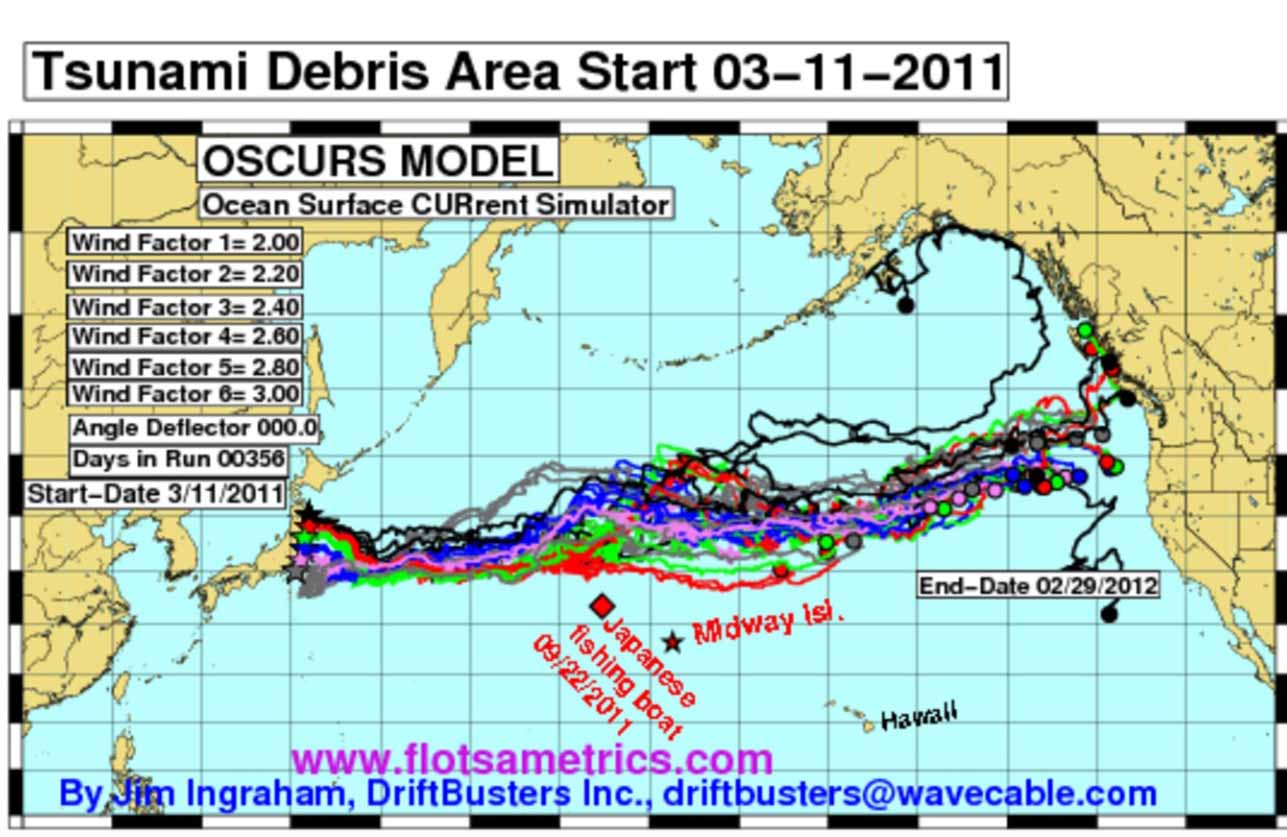
Figure 3. Possible locations of other derelict vessels based on OSCURS drift for wind factors 2-3 ending on February 29, 2012. Vessels may be in the vicinity of the colored circles at the end of the trajectories. All totaled, this computer run shows 36 drift tracks, i.e., flotsam with six wind factors starting on March 11, 2011, at six coastal locations. Start-points are stars along the tsunami coast. The colors of the 6 start-points from north to south are: black, red, green, blue, light purple, and gray. All trajectories (wiggly lines) from each start-point are the same color of that start-point. To represent various wind factors, six trajectories begin at each start point according to wind factors spaced at 0.2 intervals: 2.0, 2.2, 2.4, 2.6, 2.8 and 3.0. End-points are the circles of the same color. Most of the time, the end-points are distributed by the fastest (largest magnitude) wind factor leading the way -- as seen in the black trajectories. Each trajectory ends on February 29, 2012. Jim Ingraham OSCURS simulation.
posted by danielle's short shorts at
1:02 PM
![]()
19 Comments:
Could it be the original boat in the1949 song SlowBoat To China.
sehr guter Beitrag
The boat looks creepy. It seems there's no one in there.
It better be good! For you to deprive us of your blog all these months…
This article is simply phenomenal! It's got all the great components of an incredible article and I am truly simply content to peruse this. A commendable article to peruse! Not an exercise in futility whatsoever.
Vessel was sunk april 5, 2012.
https://en.m.wikipedia.org/wiki/Ryou-Un_Maruk april 5, 2012.
http://www.cnn.com/2012/04/05/us/japan-tsunami-ship/
https://en.m.wikipedia.org/wiki/Ryou-Un_Maru
ChenilleCleaners.com is all-around subsidized organizations framed on the accompanying three rules that we accept are vital with a specific end goal to offer the best cleaning knowledge to our clients. With our clients' fulfillment as our essential goal, we at Chenille Cleaners perspective being spotless way past clean garments. We trust it is our obligation to our clients to guarantee that not just they get the best quality in cleaning, the earth where the garments is prepared is likewise similarly as perfect with no unsafe or debilitating conditions to our clients, to our surroundings, and administrations are accessible Manhattan cleaning, pick up wash and fold, NYC get cleaning, shoddy cleaners, clothing and cleaning administrations, get wash and overlay.
This article is simply phenomenal! It's got all the great components of an incredible article and I am truly simply content to peruse this. A commendable article to peruse! Not an exercise in futility whatsoever. college gift baskets
No doubt this is an excellent post I got a lot of knowledge after reading good luck. Theme of blog is excellent there is almost everything to read, Brilliant post. Kartikeya Sharma
I live in California near the coast, I've been surfing 15 times this summer and nothing has washed up on our shores.
howdy, your websites are really good. I appreciate your work.
agen judi deposit 25 ribu
I am regular visitor, how are you everybody? This paragraph posted at this website is genuinely fastidious. 먹튀검증
Just desire to say your article is as surprising. The clearness in your post is simply great and i can assume you are an expert on this subject. 바카라사이트인포
I was studying some of your articles on this site and I think this web site is really informative! Keep putting up. 릴게임
Уour blog providеd us useful information to work on. Үou have done a marvelous job! 텍사스홀덤사이트
I'm looking for a lot of data on this topic. The article I've been looking for in the meantime is the perfect article.
스포츠토토
kralbet
betpark
tipobet
slot siteleri
kibris bahis siteleri
poker siteleri
bonus veren siteler
mobil ödeme bahis
betmatik
DS1
TYHNJYHJMVHJJ
شركة تسليك مجاري بالاحساء
This is such an interesting and thought-provoking post! The story of the tsunami ghost boat drifting is fascinating. It really makes you think about the power of nature and the mysteries it holds. Thanks for sharing this captivating piece! Also, if anyone ever finds themselves in need of expert legal help, feel free to check out this abogado de patrimonio. It’s always great to have reliable professionals on your side!
Post a Comment
Subscribe to Post Comments [Atom]
<< Home